
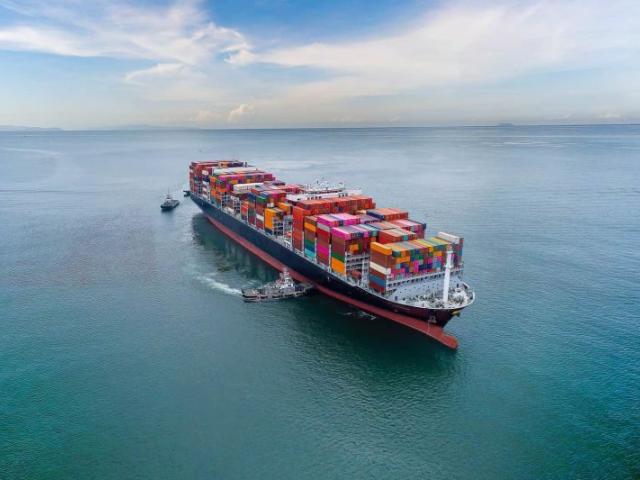
In the first half of 2026, the global container shipping market experienced volatile fluctuations amid a mix of bullish and bearish factors. After hitting 2,850 points at the beginning of the year, the Shanghai Containerized Freight Index (SCFI) underwent two notable corrections, falling back to around 2,420 points by early June—still 18% higher than the same period last year, confirming an overall upward shift in the market's freight rate baseline.
1. Market Operation Characteristics
Freight Rate Trend: Rising First, Then Falling, with a Higher Center of Gravity
From January to February, driven by concentrated shipments ahead of the Chinese New Year and ongoing Red Sea diversions, the SCFI index briefly climbed to 2,850 points, hitting a new high since 2024. Starting in March, as post-holiday shipment pace slowed and new vessels were delivered in concentration, freight rates entered a downward channel, though the decline was relatively mild. By route, European route freight rates fell by about 22% cumulatively in March before stabilizing in May, while the U.S. West Coast route fluctuated within a narrow range of 2,800–3,200 USD/FEU.
Capacity Supply: Record New Ship Deliveries, Effective Capacity Still Constrained
According to Alphaliner data, the global container fleet added approximately 1.8 million TEU of new capacity in the first half of 2026, with ships over 12,000 TEU accounting for more than 60%. The massive delivery of new ships has not fully translated into effective capacity—the Red Sea situation has forced major shipping lines to continue routing around the Cape of Good Hope, extending voyage times by 10–14 days per trip, equivalent to absorbing about 6%–8% of global capacity. Shipping lines have flexibly managed capacity through blank sailings, slow steaming, and route adjustments, keeping freight rates at relatively high levels.
Demand side: Global trade recovers moderately
The International Monetary Fund (IMF) April *World Economic Outlook* forecast global trade volume growth of 3.3% in 2026, up from 2.8% in 2025. Chinese customs data show that in the first five months, exports denominated in US dollars increased by 4.8% year-on-year, of which exports to ASEAN grew by 9.2%, exports to Latin America grew by 11.5%, while export growth to Europe and the United States slowed to 2.1%. The Regional Comprehensive Economic Partnership (RCEP) continued to release trade dividends, with container cargo volume within Asia increasing by about 7%.
2. In-depth Analysis of Key Routes
North American routes: long-term contract negotiations dominate market pace
The core focus of the U.S. route market in the first half of the year was the annual long-term contract negotiations. As spot freight rates remained high during negotiations, the competition between carriers and shippers was intense. In the end, long-term contract rates on the U.S. West Coast route were locked at $1,600–$1,800 per FEU, about 25% higher than the previous year's contract rates. Benefiting from the recovery of the Panama Canal's transit capacity, the U.S. East Coast route had relatively ample space supply, with long-term contract rates increasing by about 15%.
Europe Routes: Geopolitics Reshaping the Shipping Landscape
The Red Sea crisis continues to drive the reshaping of Europe-bound shipping routes. Major shipping companies have gained increasingly mature operational experience on the Cape of Good Hope route, with schedule reliability recovering to 52%, though still below the pre-crisis level of 75%. Notably, a growing volume of China–Europe cargo is being diverted to the China–Europe Railway Express. In the first five months of 2026, the number of China–Europe freight train trips increased by approximately 12% year-on-year to 7,200 trains, providing European shippers with an important alternative transport option.
Intra-Asian routes: RCEP dividends continue to be released
Intra-Asian routes were one of the best-performing segments in the first half of the year. Freight rates on routes from China to Vietnam and Thailand remained stable in the range of 400–600 USD/TEU, with slot utilization maintained above 90%. The rapid growth of cross-border e-commerce exports is the main driver—Chinese logistics companies such as Cainiao and J&T Express have continued to expand their warehousing and distribution networks in Southeast Asia, driving demand for the Trans-Asian Railway and sea-rail intermodal transport.
III. Outlook for the Second Half of the Year and Strategic Suggestions
Looking ahead to the second half of the year, the market will enter the traditional peak season (July–October), but fundamental conditions have already undergone subtle changes: on the supply side, pressure from new vessel deliveries will further intensify in the second half (estimated at approximately 2 million TEU); on the demand side, the inventory restocking cycle in Europe and the United States may be nearing its end. Based on forecasts from multiple institutions, global container shipping volume growth in 2026 is expected to be around 3%–4%, and freight rates are likely to rebound modestly during the peak season but may find it difficult to surpass the highs seen in the first half of the year.
For cargo owners, the following strategies are recommended: (1) combine long-term contracts with spot rates to secure baseline volumes while retaining flexibility; (2) consider China-Europe Railway Express and multimodal transport solutions as supplements to ocean shipping; (3) use digital booking platforms to compare quotes from multiple carriers and reduce procurement costs.
Bofeng Logistics will continue to monitor market dynamics and, relying on long-term agreements with multiple shipping companies, provide customers with competitive freight rates and stable space guarantees. For real-time quotes, welcome to visit our online inquiry system.